Part 1 · A LINE OA platform
The client sells foreclosed property and manages bad debt. Enquiries came through agents' personal LINE accounts, phone and email, with no shared record, so two agents could claim one customer and end up in a commission dispute.
Their RFP asked for one LINE Official Account platform for seven roles, from guests and outside agents to borrowers and admins, linked to their existing systems.
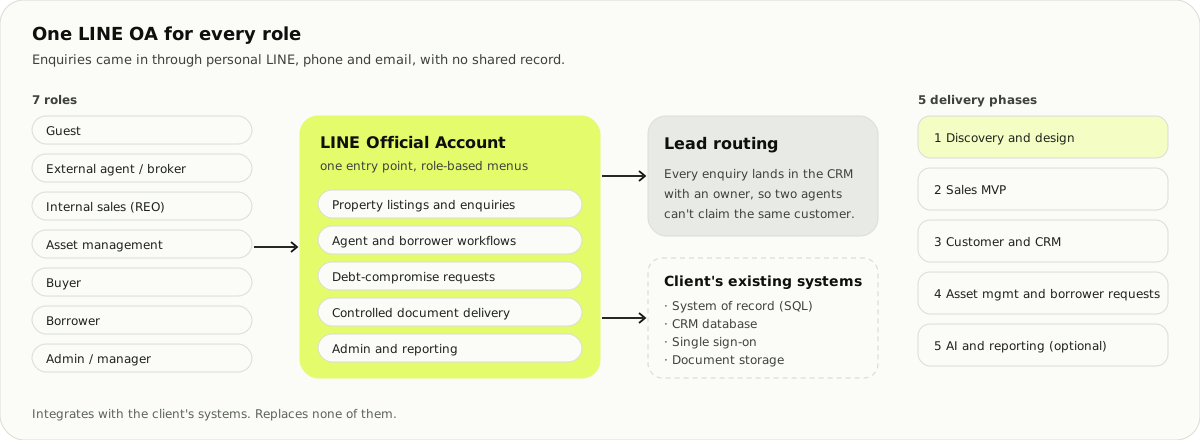
I ran discovery workshops with the team and wrote the UX and BA sections of our response: agent and borrower workflows, and how a lead reaches an owner in the CRM. The team presented it with a demo.
Part 2 · A plate system that is really an audit tool
A car dealer group with several branches wanted new plate cameras. The old system kept failing and its vendor had closed, so guards photographed cars by hand. The brief had three lines: record plates, match cars in to cars out, and find which employee did something wrong.
The third line changed the job. A gate decides and forgets; this system had to keep a record that holds up later. Retention, audit trail and reports mattered more than speed at the barrier.
Discovery before screens
- Requirements and site constraints from the team's FigJam board: one pole, no drilling, an entrance wide enough for two trucks.
- User journeys for seven personas, from the guard at the gate to the branch manager, auditor and executive.
- A service blueprint. It showed the driver never touches the software. The only customer touchpoint is the privacy sign at the gate.
- Camera and vendor research, with prices and integration options, for the proposal.
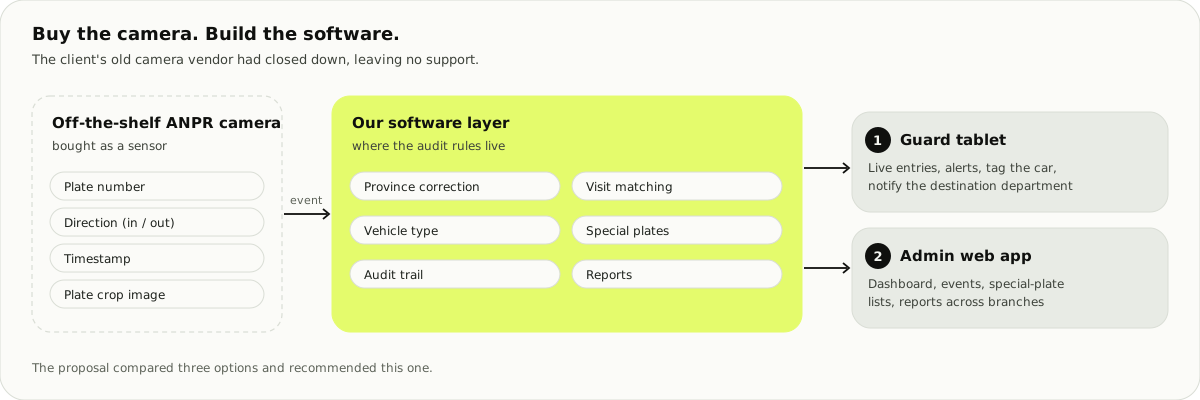
I wrote the proposal deck with the team. It compared three options.
Match by visit
My first dashboard paired each entry with the next exit. Then we walked through a repair job: a technician drives the car out and back during the work, so one job can cross the gate six times. Paired, that looks like three short trips, with gaps where the car seems gone.
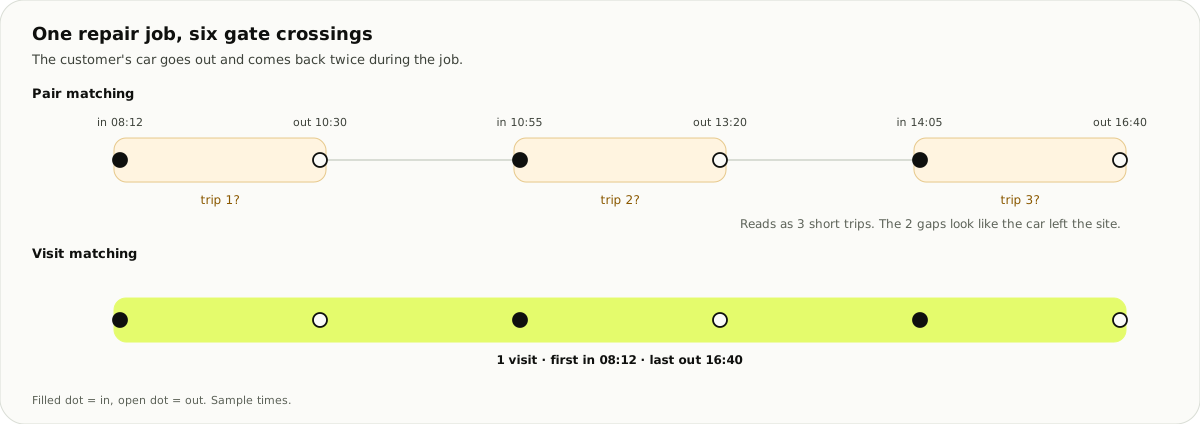
So a row in the system is a visit, with a first in and a last out, and every crossing inside it. The car detail screen shows all of them.
What kind of car is it?
The old app had a 16-button "service type" screen. Most buttons were departments: it recorded where a car was going, never what kind of car it was, and staff cars had no category at all. I proposed splitting the two: a few facets for the vehicle, and a separate destination department.
A design library for the web app
I built the Figma library before the screens: primitives, semantic tokens, and components that read only the semantic layer. A second colour mode re-skins everything for a darker, premium look.
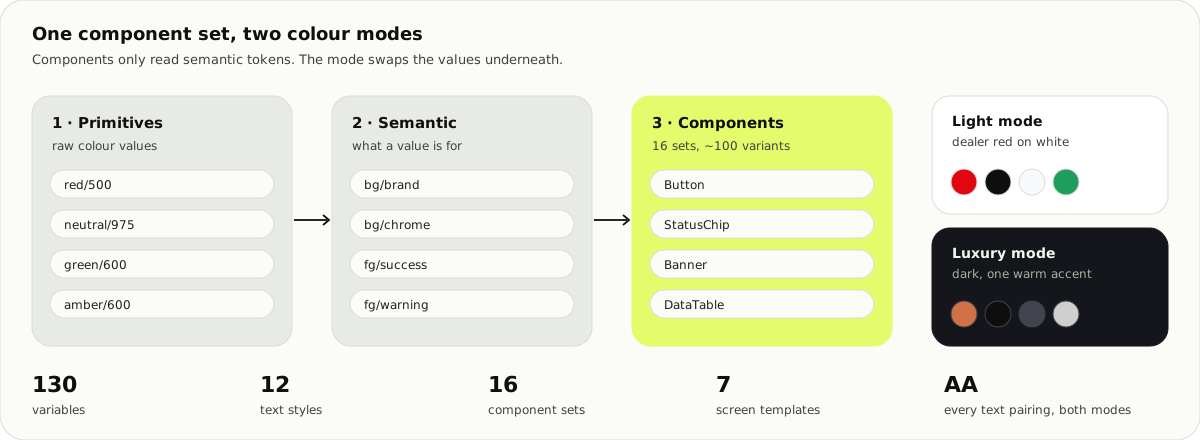
I checked every text pairing for contrast. Warning, link and muted text were too light, and the critical alert banner sat at 4.45:1 because of an 85% opacity fill. I darkened the three colours and fixed the banner.
The first screens
| Screen | What it handles |
|---|---|
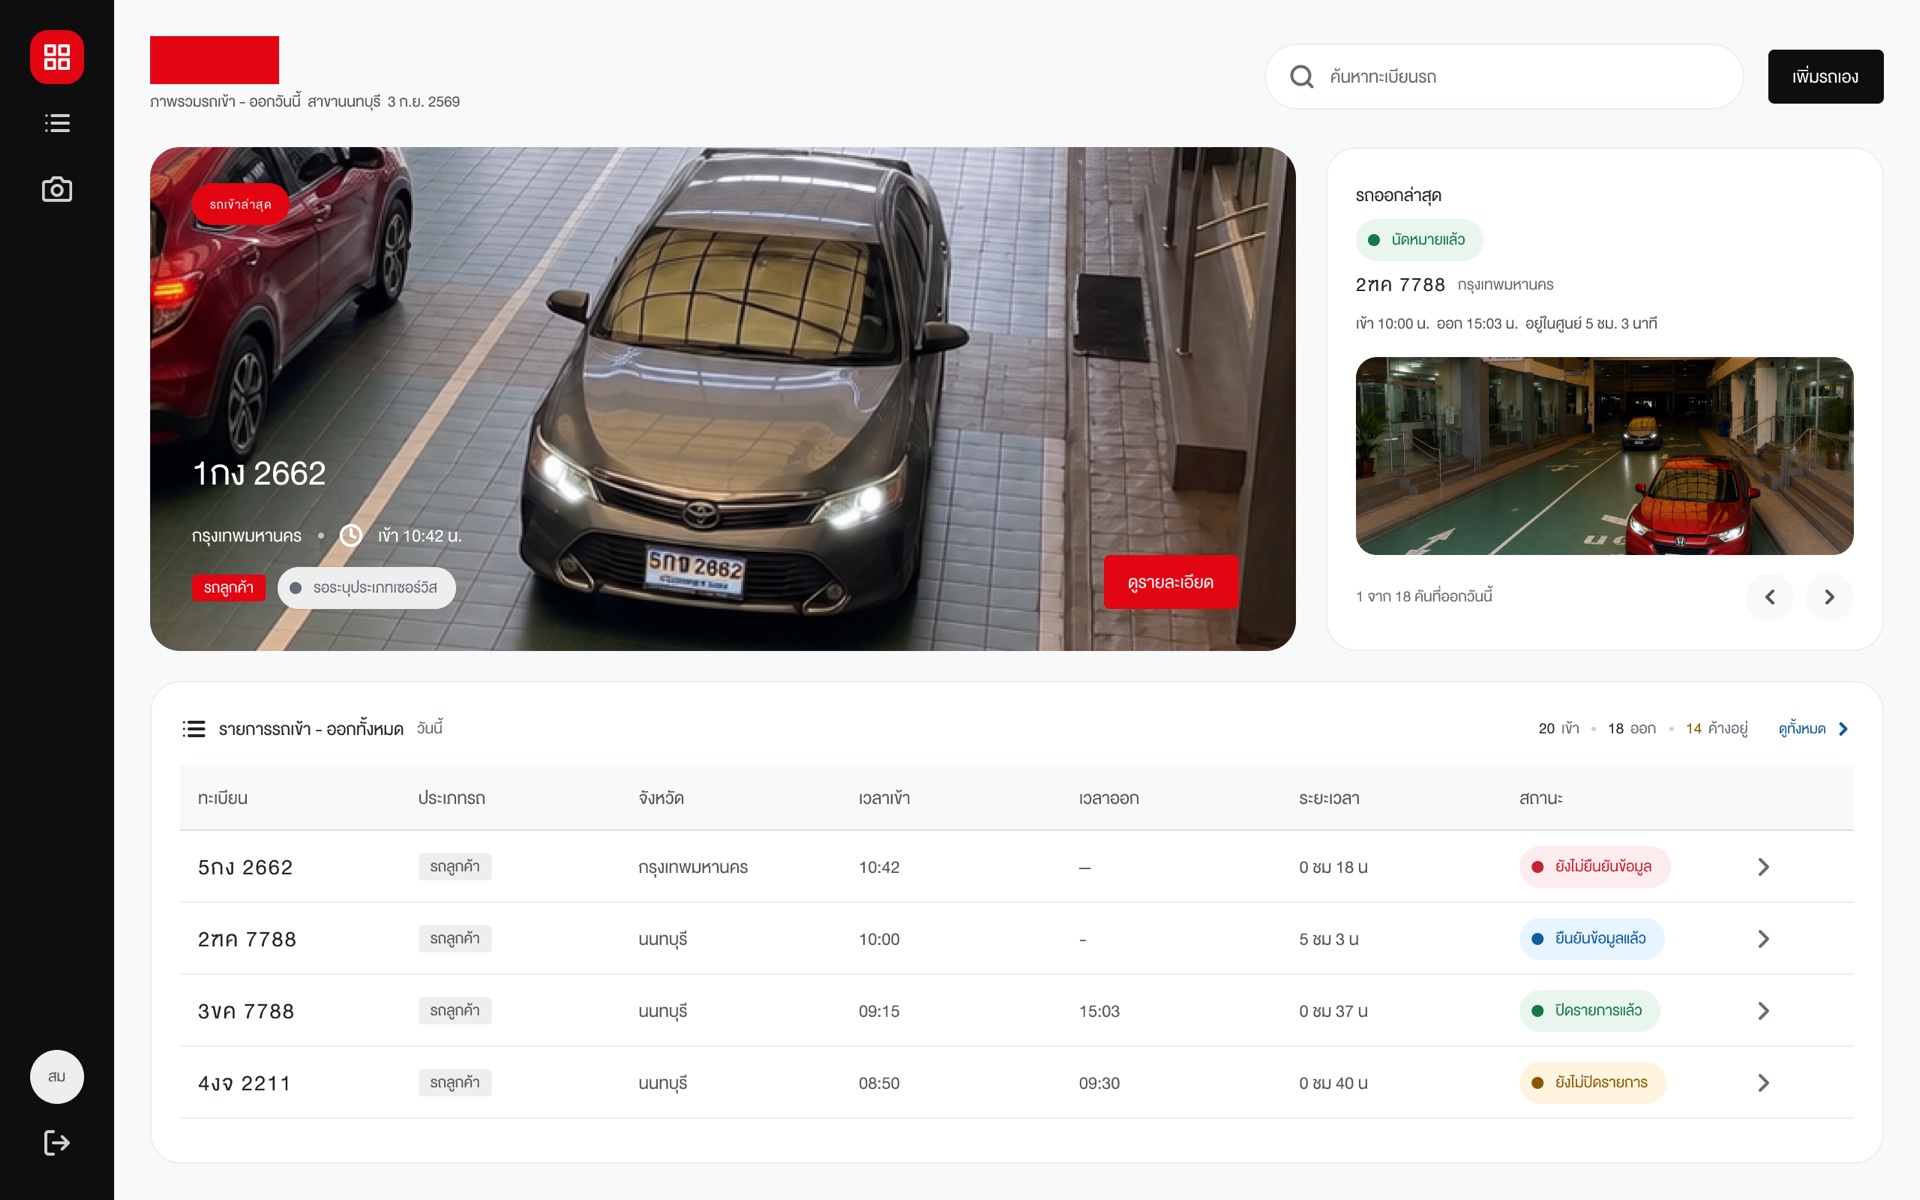
| Guard tablet · home | Latest car in, today's list, alerts for banned and VIP cars, and adding a car by hand |
| Car detail, 3 states | In but not out yet · six crossings, one visit · exit only, a test drive over its time limit |
| Admin · add a plate | Empty form, duplicate warning, success. It shows the normalised plate the system will match on, so a typo is caught while typing |
| Admin · dashboard and events | Entries and exits across branches, unmatched visits, cameras online |
What I learned: cut the design back
The LINE OA RFP was detailed, so our first draft designed too much. A senior reviewer sent it back: we didn't know enough yet, and designing from assumptions would lock in answers before discovery. The second draft left those decisions to discovery.